Learn how to build a globally diversified portfolio from India. 7 of 12 chapters are live, covering LRS, FX, global indexes, and Irish ETFs.
I am publishing two portfolio reports:
- State of the Portfolio (Annual) — published every April [first edition here]
- State of the 1 Portfolio (Monthly) — published every other month [Current one is the first edition]
The 1 Portfolio represents the core long-term wealth portfolio, excluding the Emergency and Travel funds.
Portfolio Snapshot — May 2026
| Metric | Value |
|---|---|
| Portfolio Strategy | Global Multi-Asset Passive Investing using Indian Mutual Funds & Irish ETFs |
| 1 Portfolio XIRR | 19.13% |
| Total Portfolio XIRR | 14.13% |
| Target Equity Allocation | 85% |
| Largest Market Value | Nasdaq 100 (37.65%) |
| Rebalancing Method | Perpetual Rebalancing |
| International Broker | IBKR (Tiered) |
| FX Optimization | FX Retail + Bharat Connect via BHIM |
The Portfolio Summary
The overall portfolio delivered 14.13% XIRR.
| Goal | Purpose | XIRR | Growth Share |
|---|---|---|---|
| 1 Portfolio | The Core Portfolio for Building Wealth | 19.13% | 93.43% |
| Emergency | To cater to emergencies | 7.38% | 5.64% |
| Travel | To cover domestic/international trips | 7.08% | 0.84% |
| Legacy transactional error currently waiting for clean up | 7.12% | 0.09% | |
| Total | 14.13% | 100.00% |
Notes:
- XIRR computed using latest NAVs available on May 1, 2026 before May month investments
- XIRR computation excluded all 0 balance funds which were exited earlier
- Emergency Fund had significant historical volume in a liquid fund, so pulling down the overall XIRR
- The portfolio is currently in the 8-figure INR range.
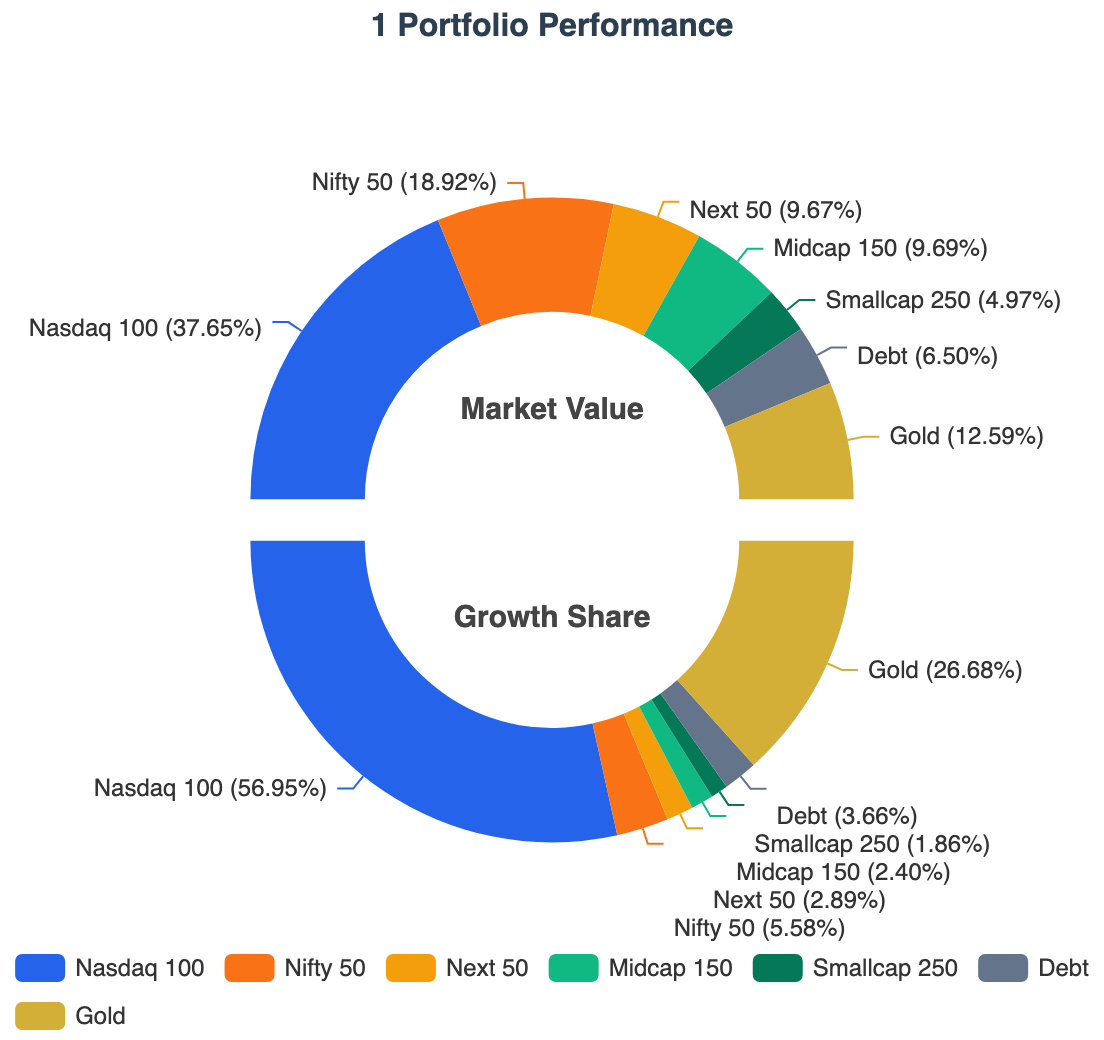
1 Portfolio — Asset Class Breakdown
Following is the current state of the 1 Portfolio.
| Asset Class | XIRR | Growth Share | Current Allocation (on May 1, 2026) |
Target Allocation (for TY 2026-27) |
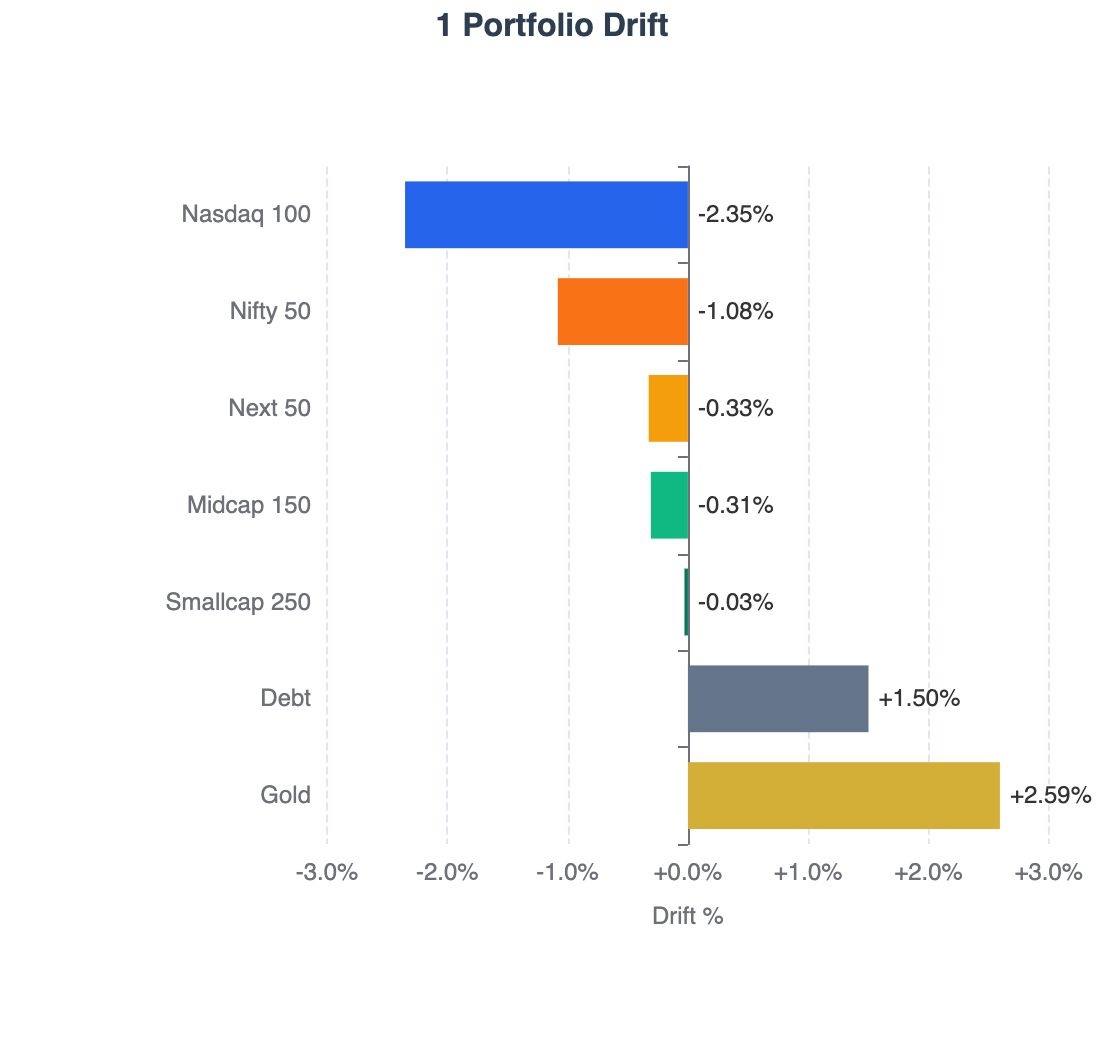
Drift |
|---|---|---|---|---|---|
| Nasdaq 100 | 35.30% | 56.95% | 37.65% | 40% | -2.35% |
| Nifty 50 | 4.06% | 5.58% | 18.92% | 20% | -1.08% |
| Next 50 | 35.26% | 2.89% | 9.67% | 10% | -0.33% |
| Midcap 150 | 27.94% | 2.40% | 9.69% | 10% | -0.31% |
| Smallcap 250 | 53.32% | 1.86% | 4.97% | 5% | -0.03% |
| Debt | 7.29% | 3.66% | 6.50% | 5% | +1.50% |
| Gold | 41.56% | 26.68% | 12.59% | 10% | +2.59% |
| Total | 19.13% | 100% | 100% | 100% | 4.09% |
Growth Share represents the percentage contribution of each asset class to the portfolio’s total gains.
Used RealValue Portfolio to tag goals/asset classes to derive the XIRR.
Your data stays with you! All processing done in your browser!Currently supports CAMS + KFinTech combined PDF (Indian Mutual Funds) and IBKR (International Investments). Check it out if you want to build your own report for domestic investment or international ones or both!
Key Performance Drivers
- Concentrated Growth: The Nasdaq 100 is the undisputed powerhouse of the portfolio. Despite being slightly underweight currently, it accounts for 56.95% of the total growth share. Underweight is mainly due to change in target allocation from 35% to 40%.
- Gold Outperformance: Gold has significantly exceeded expectations with a 41.56% XIRR, leading to the largest positive drift in the portfolio (+2.59%). Gold outperformance peaked at +7% above target before I merged multiple goals and performed hard rebalancing.
- Domestic Lag: The Nifty 50 remains the primary laggard with an XIRR of only 4.06%, contributing just 5.58% to the overall growth share despite being the second-largest allocation.
In a globally diversified portfolio, performance leadership rotates continuously. The objective is not to predict the next winner, but to systematically rebalance capital toward undervalued assets.
My Strategy is to use Perpetual Rebalancing to do both Value Buying (buy assets with negative drift) and Momentum Capturing (dynamically sell over a period of 6 months to reduce overall drift from say 10% to 4%).
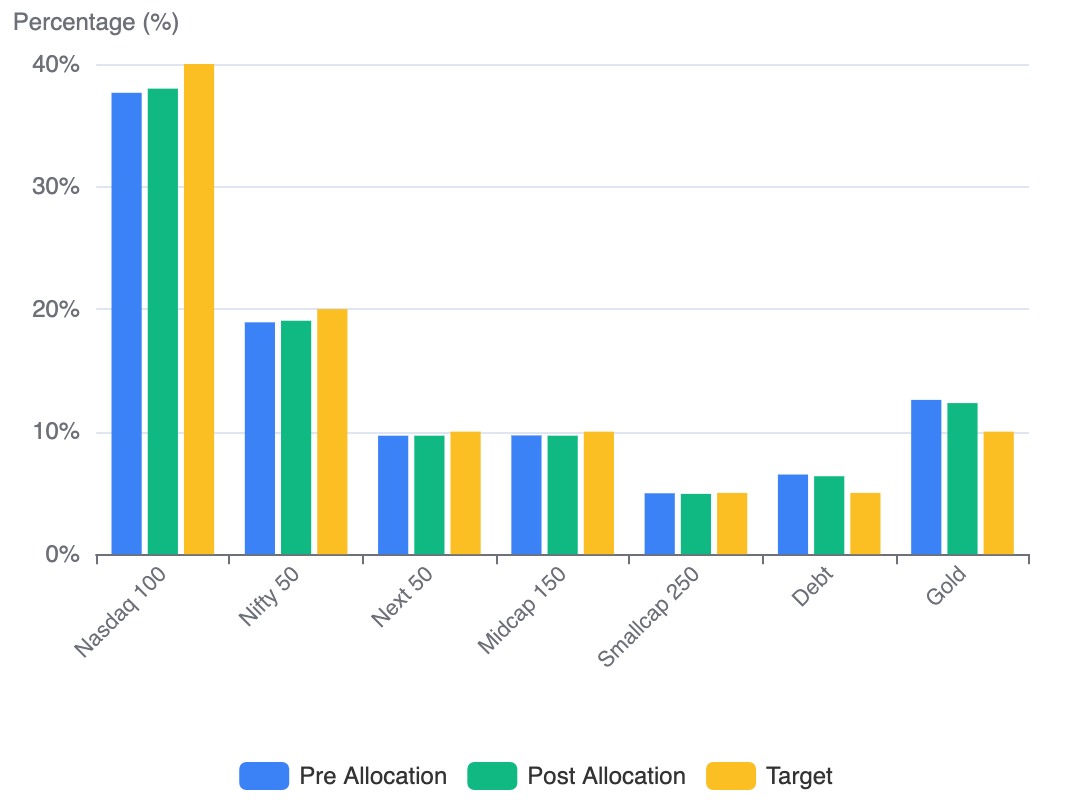
Drift Correction aka Monthly Investment Allocation for May 2026
The table below consolidates the current state, May 2026 investment allocation and the target allocation in one view:
| Asset Class | Current | Pre Drift | New Invest | Post Alloc | Post Drift | Target |
|---|---|---|---|---|---|---|
| Nasdaq 100 | 37.65% | -2.35% | 53.79% | 38.00% | -2.00% | 40.00% |
| Nifty 50 | 18.92% | -1.08% | 25.76% | 19.07% | -0.93% | 20.00% |
| Next 50 | 9.67% | -0.33% | 9.09% | 9.66% | -0.34% | 10.00% |
| Midcap 150 | 9.69% | -0.31% | 9.09% | 9.68% | -0.32% | 10.00% |
| Smallcap 250 | 4.97% | -0.03% | 2.27% | 4.91% | -0.09% | 5.00% |
| Debt | 6.50% | +1.50% | 0.00% | 6.36% | +1.36% | 5.00% |
| Gold | 12.59% | +2.59% | 0.00% | 12.32% | +2.32% | 10.00% |
| Total | 100.00% | 4.09% | 100.00% | 100.00% | 3.67% | 100.00% |
Definitions
- Asset Class: Underlying asset class part of the 1 Portfolio
- Current: Actual market value
- Pre Drift: Current deviation from target (sum of positive values = total drift)
- New Invest: Percentage of next monthly investment directed to each asset class
- Post Alloc: Estimated market value after the investment
- Post Drift: Estimated drift after investment
- Target: Target allocation for the asset class
- Total Drift: Drift is calculated as the sum of positive deviations from target allocations
Used the RealValue Family SIP Allocator framework — monthly investments are directed exclusively to underweight assets, proportional to their deficit from target. Includes support for Multiple investor and TCS adjusted allocation for International investments.
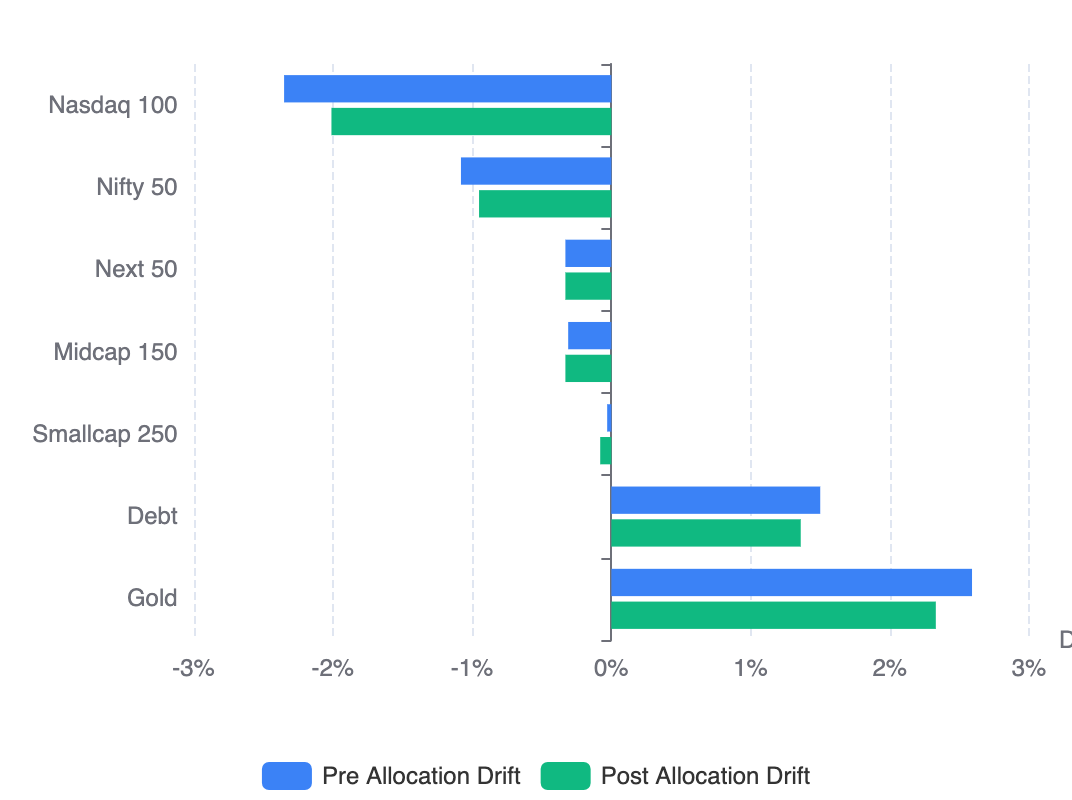
New Allocation: 2.25%, Drift Correction: 0.42% (from 4.09% to 3.67%)
Key Observations from this month’s allocation
- Nasdaq 100 receives 53.79% of the next investment — as the most underweight asset relative to its large 40% target, it remains the primary destination for fresh capital.
- Tiered Domestic Allocation - Fresh funds are being funneled into Nifty 50 (25.76%), mid-tier equities (~9% each for Next 50 and Midcap 150) and smallcaps (2.27%) to ensure the entire equity sleeve moves upward in unison.
- Gold and Debt receive zero — both assets are currently overweight. By directing no new funds here, their weightage naturally “drifts” down toward the target as the equity base grows.
- Total portfolio drift reduces from 4.09% to 3.67% — a meaningful 0.42% correction achieved solely through a single monthly cash flow, avoiding the tax impact of selling winners.
Optimizing International Investment
For International Investment, Forex Cost and Broker Cost will be a huge drag if not optimized.
Direct IBKR Account
For Broker Cost optimization, I set up a direct account with IBKR with tiered pricing.
Earlier used an account created via ICICI Direct Global which was using a fixed pricing model.
Main differences are
- Direct IBKR access gets full access to the IBKR environment including Desktop app
- Tiered pricing minimum is ~$1.7 where as Fixed plan I was using earlier was minimum $4
- There was a fixed ₹999/year plan I subscribed with ICICI Direct Global. With direct IBKR it is $0/year
Migration In Progress
- I was able to move the residual Cash from older account to the newer one seamlessly
- Positions are still in the old account but planning to move them to the new account as well
- Planning to buy this month allocation in the new account
Forex Optimization
For international investments, the foreign exchange transaction cost on INR-to-USD conversion is a recurring drag that compounds over years of regular funding. Optimizing it matters.
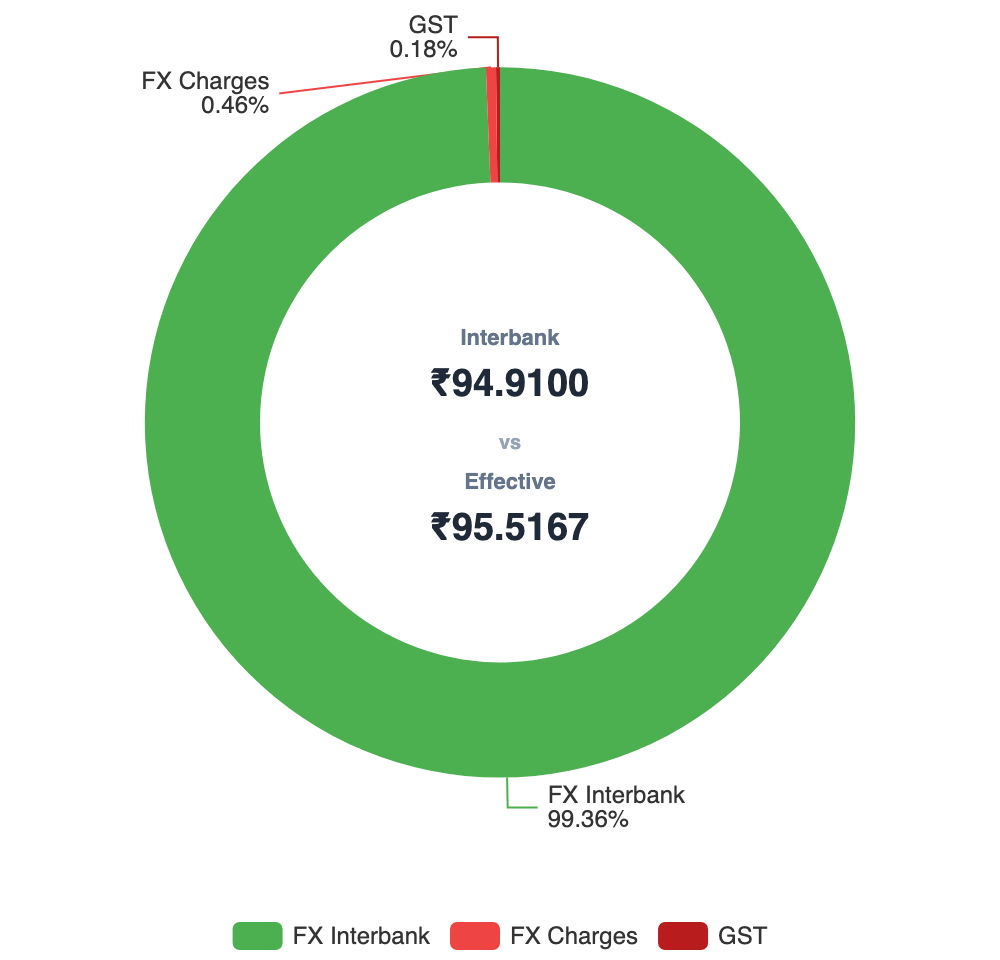
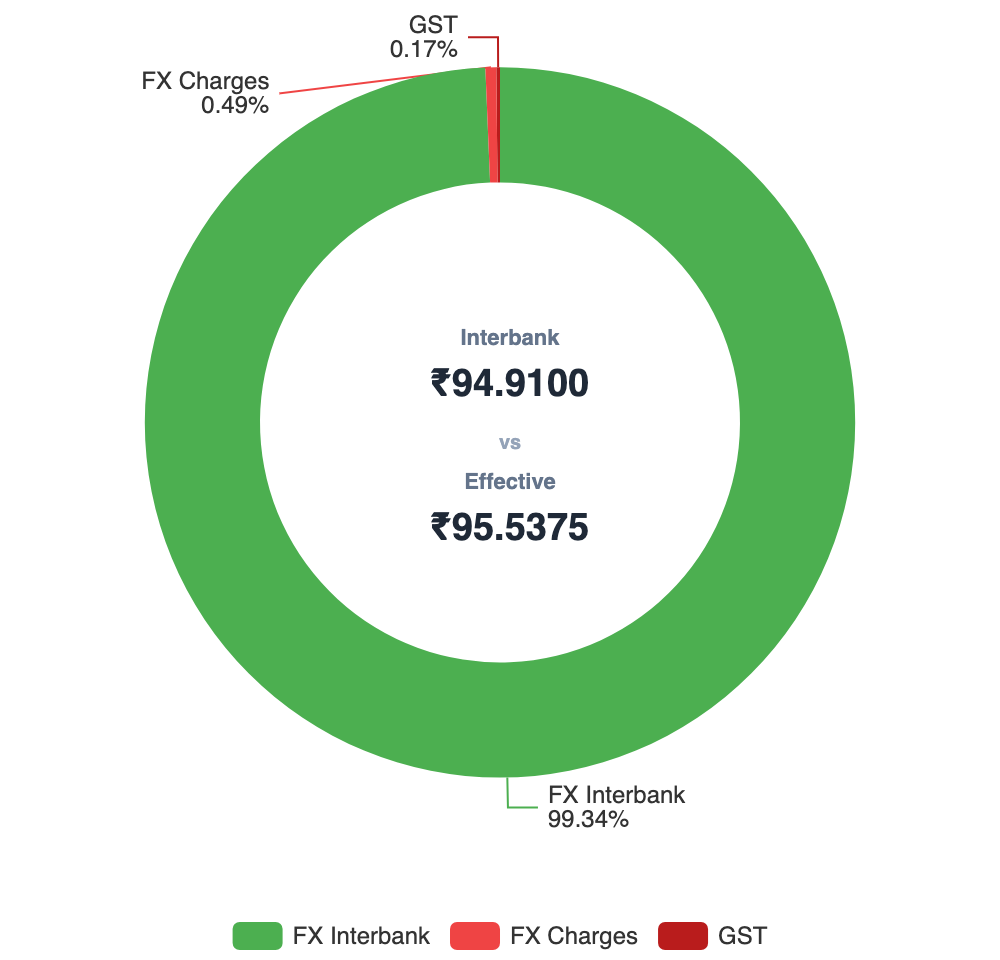
| Option 1 | Option 2 | Option 3 | |
|---|---|---|---|
| Bank | ICICI Bank | Bank of Baroda | ICICI Bank |
| Channel | Direct Bank | FX Retail Web | FX Retail + Bharat Connect + BHIM |
| Interbank Rate | ₹94.91/USD | ₹94.91/USD | ₹94.91/USD |
| Bank Rate | ₹96.54/USD | ₹95.01/USD | ₹95.11/USD |
| FX Spread | ₹1.63/USD | ₹0.10/USD | ₹0.20/USD |
| Processing Fee | ₹1,000 + GST | ₹1,250 + GST | ₹1,000 + GST |
| Effective Rate | ₹96.97/USD | ₹95.52/USD | ₹95.54/USD |
| Transaction Cost % | 2.17% | 0.64% | 0.66% |
| Visual Reference | 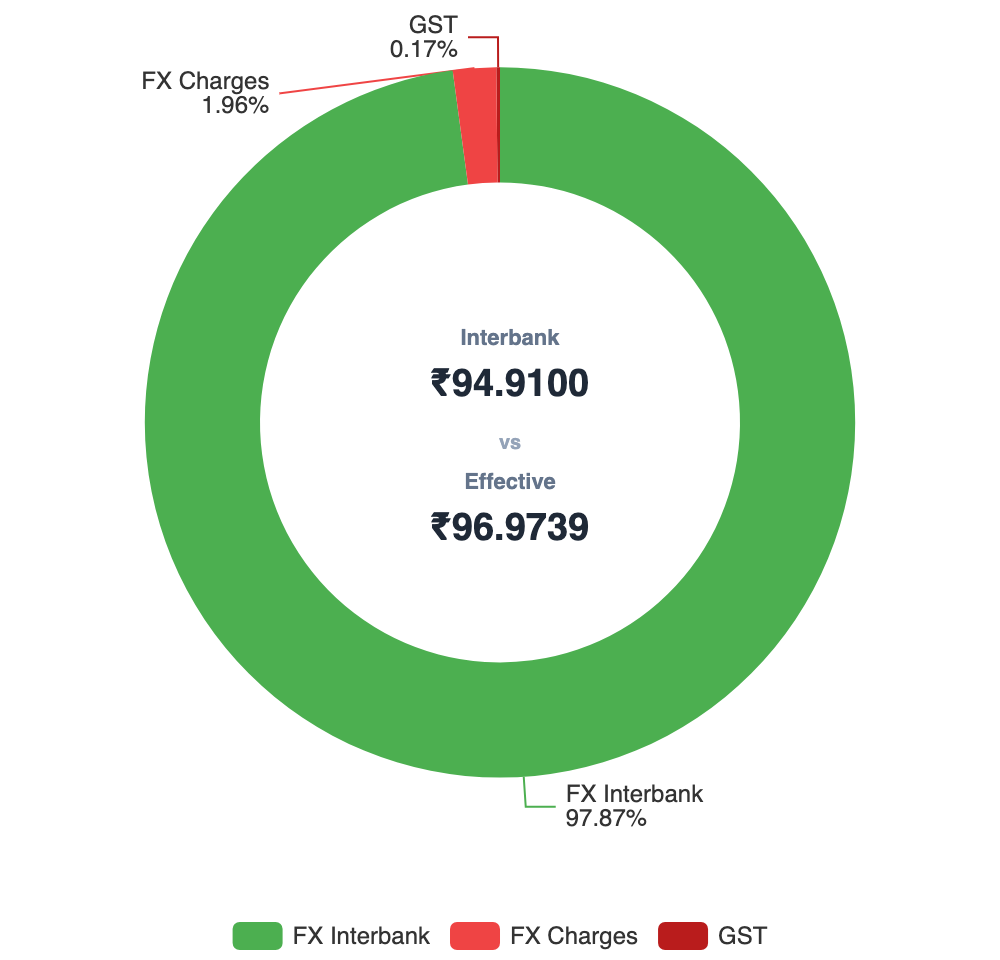 |
 |
 |
- Computation based on 2 May 2026 mid-market rate from public sources (Google) and ICICI FX rate in Money2World. (FX Retail ones just added 10p/USD or 20p/USD as applicable). Computed using my actual allocation (6 figure INR).
- The higher the allocation, the lower the effective transaction cost
- Switching to FX Retail with Bank of Baroda reduces the effective transaction cost from 2.17% to 0.64% — a saving of ~1.53% per transfer. The key driver is BoB’s exceptionally low FX spread of just ₹0.10/USD through FX Retail.
- Interestingly, FX Retail via Bharat Connect (using apps such as BHIM) allows private banks to process forex transfers with only a ₹0.20/USD markup. So we get the speed of private banks at the cost of public bank.
Used the RealValue FX Engine to find the true transaction cost and compare various rates.
Using to compute/track TCS for Form 122 (previously known as 12BAA Form) and to find the TCS opportunity cost.
Key lessons for me
- Equity recovering improved overall market value of the 1 Portfolio
- Most importantly, drift came down to 4.09% even prior to new allocation
- Broker cost optimized for Global Investment
- Still optimizing the FX Cost with newer channels like FX Retail via Bharat Connect
- Speed of capital deployment is as important as Markup optimizations for Global Investment
Forward Expectations | Guessing the Future Allocation
- I am anticipating that equity recovery/growth will continue for few months
- Nasdaq will swing up so fast that I will stop allocating to it this year sometime
- I will see Gold/Debt fund allocation by the system this year
- Nifty performance remains muted relative to global equities and may require policy catalysts to regain leadership
- Still not sure If I will hit 0% drift perfection this year!
Transparency Note
This portfolio reflects my personal investment strategy and risk tolerance. It is not investment advice.